Daniel Janus’s blog
Color your own Europe with Clojure!
11 July 2011
This is a slightly edited translation of an article I first published on my Polish blog on January 19, 2011. It is meant to target newcomers to Clojure and show how to use Clojure to solve a simple real-life problems.
The problem
Some time ago I was asked to prepare a couple of differently-colored maps of Europe. I got some datasets which mapped countries of Europe to numerical values: the greater the value, the darker the corresponding color should be. A sample colored map looked like this:
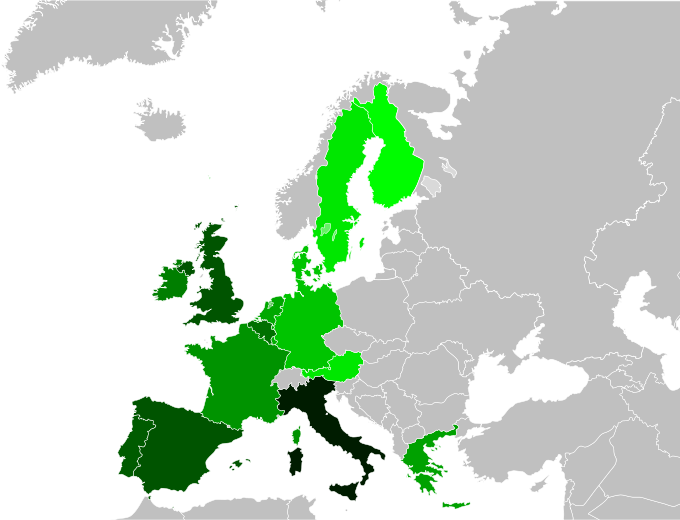
I began by downloading an easily editable map from Wikipedia Commons, calculated the required color intensities for the first dataset, launched Inkscape and started coloring. After half an hour of tedious clicking, I realized that I would be better off writing a simple program in Clojure that would generate the map for me. It turned out to be an easy task: the remainder of this article will be an attempt to reconstruct my steps.
SVG
The format of the source image is SVG. I knew it was an XML-based vector graphics format, I’d often encountered images in this format on Wikipedia — but editing it by hand was new to me. Luckily, it turned out that the image has a simple structure. Each country’s envelope curve is described with a path element that looks like this:
<path
   id="pl"
   class="eu europe"
   d="a long list of curve node coordinates" />
An important thing to note here is the id attribute — this is the two-letter ISO-3166-1-ALPHA2 country code. In fact, there is an informative comment right at the beginning of the image that explains the naming conventions used. Having such a splendid input was of great help.
Just like HTML, SVG uses CSS stylesheets to define the look of an element. All that is needed to color Poland red is to style the element with a fill attribute:
<path
   id="pl"
   style="fill: #ff0000;"
   class="eu europe"
   d="a long list of curve node coordinates" />
Now that we know all this, let’s start coding!
XML in Clojure
The basic way to handle XML in Clojure is to use the clojure.xml namespace, which contains functions that parse XML (on a DOM basis, i.e., into an in-memory tree structure) and serialize such structures back into XML. Let us launch a REPL and start by reading our map and parsing it:
> (use 'clojure.xml)
nil
> (def m (parse "/home/nathell/eur/Blank_map_of_Europe.svg"))
[...a long while...]
Unexpected end of file from server
  [Thrown class java.net.SocketException]
Hold on in there! What’s that SocketException doing here? Firefox displays this map properly, so does Chrome, WTF?! Shouldn’t everything work fine in such a great language as Clojure?
Well, the language is as good as its libraries — and when it comes to Clojure, one can stretch that thought further: Clojure libraries are as good as the Java libraries they use under the hood. In this case, we’ve encountered a feature of the standard Java XML parser (from javax.xml package). It is restrictive and tries to reject invalid documents (even if they are well-formed). If the file being parsed contains a DOCTYPE declaration, the Java parser, and hence clojure.xml/parse, tries to download the DTD schema from the given address and validate the document against that schema. This is unfortunate in many aspects, especially from the point of view of the World Wide Web Consortium, since their servers hold the Web standards. One can easily imagine the volume of network traffic this generates: W3C has a blog post about it. Many Java programmers have encountered this problem at some time. There are a few solutions; we will go the simplest way and just manually remove the offending DOCTYPE declaration.
> (def m (parse "/home/nathell/eur/bm.svg"))
#'user/m
> m
[...many screenfuls of numbers...]
This time we managed to parse the image. Viewing the structure is not easy because of its sheer size (as expected: the file weighs in at over 0,5 MB!), but from the very first characters of the REPL’s output we can make out that’s it a Clojure map (no pun intended). Let’s examine its keys:
> (keys m)
(:tag :attrs :content)
So the map contains three entries with descriptive names. :tag contains the name of the XML element, :attrs is a map of attributes for this element, and :content is a vector of its subelements, each in turn being represented by similarly structured map (or a string if it’s a text node):
> (:tag m)
:svg
> (:attrs m)
{:xmlns "http://www.w3.org/2000/svg", :width "680", :height "520", :viewBox "1754 161 9938 7945", :version "1.0", :id "svg2"}
> (count (:content m))
68
Just for the sake of practice, let’s try to write the serialized representation of the parsed back as XML. The function emit should be able to do it, but it prints XML to standard output. We can use the with-out-writer macro from the namespace clojure.contrib.io to dump the XML to a file:
> (use 'clojure.contrib.io)
nil
> (with-out-writer "/tmp/a.svg" (emit m))
nil
We try to view a.svg in Firefox and…
Error parsing XML: not well-formed
Area: file:///tmp/a.xml
Row 15, column 44: Updated to reflect dissolution of Serbia & Montenegro: http://commons.wikimedia.org/wiki/User:Zirland
                 -------------------------------------------^
It turns out that using clojure.xml/emit is not recommended, because it does not handle XML entities in comments correctly; we should use clojure.contrib.lazy-xml instead. For the sake of example, though, let’s stay with emit and manually remove the offending line once again (we can safely do it, since that’s just a comment).
Coloring Poland
We saw earlier that our main XML node contains 68 subnodes. Let’s see what they are — tag names will suffice:
> (map :tag (:content m))
(:title :desc :defs :rect :path :path :path :path :path :path :path :path :path :path :path :path :path :path :path :path :path :path :path :path :path :path :path :path :path :path :path :path :path :path :path :path :path :path :path :path :path :path :path :path :path :path :path :path :path :path :path :path :path :path :path :path :path :path :path :path :path :g :path :path :g :path :path :path)
So far, so good. Seems that all country descriptions are contained directly in the main node. Let us try to find Poland:
> (count (filter #(and (= (:tag %) :path)
                       (= ((:attrs %) :id) "pl"))
                 (:content m)))
1
(This snippet of code filters the list of subnodes of m to pick only those elements whose tag name is path and value of attribute id is pl, and returns the length of such list.) Let’s try to add a style attribute to that element, according to what we said earlier. Because Clojure data structures are immutable, we have to define a new top-level element which will be the same as m, except that we will set the style of the appropriate subnode:
> (def m2 (assoc m
                :content
                (map #(if (and (= (:tag %) :path)
                               (= ((:attrs %) :id) "pl"))
                        (assoc % :attrs (assoc (:attrs %) :style "fill: #ff0000;"))
                        %)
                     (:content m))))
#'user/m2
> (with-out-writer "/tmp/a.svg" (emit m2))
nil
We open the created file and see a map with Poland colored red. Yay!
Generalization
We will generalize our code a bit. Let us write a function that colors a single state, taking a path element (subnode of svg) as an argument:
(defn color-state
  [{:keys [tag attrs] :as element} colorize-fn]
  (let [state (:id attrs)]
    (if-let [color (colorize-fn state)]
      (assoc element :attrs (assoc attrs :style (str "fill:" color)))
      element)))
This function is similar to the anonymous one we used above in the map call, but differs in some respects. It takes two arguments. As mentioned, the first one is the XML element (destructured into tag and attrs: you can read more about destructuring in the appropriate part of Clojure docs), and the second argument is… a function that should take a two-letter country code and return a HTML color description (or nil, if that country’s color is not specified — color-state will cope with this and return the element unchanged).
Now that we have color-state, we can easily write a higher-level function that processes and writes XML in one step:
(defn save-color-map
  [svg colorize-fn outfile]
  (let [colored-map (assoc svg :content (map #(color-state % colorize-fn) (:content svg)))]
    (with-out-writer out
      (emit colored-map))))
Let’s test it:
> (save-color-map m {"pl" "#00ff00"} "/tmp/a.svg")
nil
This time Poland is green (we used a country→color map as an argument to color-state, since Clojure maps are callable like functions). Let’s try to add blue Germany:
> (save-color-map m {"pl" "#00ff00", "de" "#0000ff"} "/tmp/a.svg")
nil
It works!
Problem with the UK
Inspired by our success, we try to color different countries. It mostly works, but the United Kingdom remains gray, regardless of whether we specify its code as “uk” or “gb”. We resort to the source of our image, and the beginning comment once again proves helpful:
Certain countries are further subdivided the United Kingdom has gb-gbn for Great Britain and gb-nir for Northern Ireland. Russia is divided into ru-kgd for the Kaliningrad Oblast and ru-main for the Main body of Russia. There is the additional grouping #xb for the “British Islands” (the UK with its Crown Dependencies – Jersey, Guernsey and the Isle of Man)
Perhaps we have to specify “gb-gbn” and “gb-nir”, instead of just “gb”? We try that, but still no luck. After a while of thought: oh yes! Our initial assumption that all the country definitions are path subnodes of the toplevel svg node is false. We have to fix that.
So far we have been doing a “flat” transform of the SVG tree: we only changed the subnodes of the toplevel node, but no deeper. We should change all the path elements (and g, if we want to color groups of paths like the UK), regardless of how deep they occur in the tree.
We can use a zipper to do a depth-first walk of the SVG tree. Let us define a function that takes a zipper, a predicate that tells whether to edit the node in question, and the transformation function to apply to the node if the predicate returns true:
(defn map-zipper [f pred z]
  (if (zip/end? z)
    (zip/root z)
    (recur f pred (-> z (zip/edit #(if (pred %) (f %) %)) zip/next)))))
Now we rewrite save-color-map as:
(defn save-color-map
  [svg colorize-fn outfile]
  (let [colored-map (map-zipper #(color-state % colorize-fn) (fn [x] (#{:g :path} (:tag x))) (zip/xml-zip svg))]
    (with-out-writer out
      (emit colored-map))))
This time the UK can be colored.
Colorizers
We have automated the process of styling countries to make them appear in color, but translating particular numbers to RGB is tedious. In the last part of this article we will see how to ease this: we are going to write a colorizer, i.e., a function suitable for passing to color-state and save-color-map (so far we’ve been using maps for this).
Let’s start by writing a function that translates a triplet of numbers into a HTML RGB notation, because it will be easier for us to work with integers than with strings:
(defn htmlize-color
  [[r g b]]
  (format "#%02x%02x%02x" r g b))
Now we insert a call to htmlize-color into the appropriate pace in color-state:
(defn color-state
  [{:keys [tag attrs] :as element} colorize-fn]
  (let [state (:id attrs)]
    (if-let [color (colorize-fn state)]
      (assoc element :attrs (assoc attrs :style (str "fill:" (htmlize-color color))))
      element)))
Now imagine we have a table with numeric values for states, like this:
| State | Value |
|---|---|
| Poland | 20 |
| Germany | 15 |
| Netherlands | 30 |
We want to have a function that assigns colors to states, such that the intensity of a color should be proportional to the value assigned to a given state. To be more general, assume we have two colors, c1 and c2, and for a given state, for each of the R, G, B components we assign a value proportional to the difference between the state’s value and the smallest value in the dataset, normalized to lie between c1 and c2.
This sounds complex, but I hope an example will clear things up. This is the Clojure implementation of the described algorithm:
(defn make-colorizer
  [dataset ranges]
  (let [minv (apply min (vals dataset))
        maxv (apply max (vals dataset))
        progress (map (fn [[min-col max-col]] (/ (- max-col min-col) (- maxv minv))) ranges)]
    (into {}
          (map (fn [[k v]] [(.toLowerCase k) (map (fn [progress [min-color _]] (int (+ min-color (* (- v minv) progress)))) progress ranges)])
               dataset))))
Let us see how it works on our sample data:
> (make-colorizer {"pl" 20, "de" 15, "nl" 30} [[0 255] [0 0] [0 0]])
{"pl" (85 0 0), "de" (0 0 0), "nl" (255 0 0)}
The second argument means that the red component is to range between 0 and 255, and the green and blue components are to be fixed at 0.
Like we wanted, Germany ends up darkest (because it has the least value), the Netherlands is lightest (because it has the greatest value), and Poland’s intensity is one third that of the Netherlands (because 20 is in one third of the way between 15 and 30).
Wrapping up
The application we created can be further developed in many ways. One can, for instance, add a Web interface for it, or write many different colorizers (e.g., discrete colorizer: fixed colours for ranges of input values, or a temperature colorizer transitioning smoothly from blue through white to red — to do this we would have to pass through the HSV color space).
What is your idea to improve on it? For those of you who are tired of pasting snippets of code into the REPL, I’m putting the complete source code with a Leiningen project on GitHub. Forks are welcome.